
Are You Mining Your Data, Hoping For Gold, And Getting Dirt?
Data is the new currency in Life Sciences and analytics is the pot of gold
What if what you think you know just ain’t so? Mark Twain is credited with saying: “It ain’t what you don’t know that gets you into trouble. It’s what you know for sure that just ain’t so.”
Certainty gone astray is risky. In Life Sciences where accuracy and transparency are top-of-mind in all that you do, it’s especially risky. Your certainty must come from data science and analytics. Besides a breakthrough product, it’s the one commodity you have that gives you the ultimate competitive advantage. It’s as good as gold!

All that glistens is not gold – an abundance of data does not mean that you can easily define strategies and outcomes, a cut above your competition. And if you don’t follow a sustainable framework for data governance, you’ll be disappointed when you learn that you dug up data that’s nothing but fool’s gold.
It’s time to start mining this gold we call data
A plethora of data is not an issue for successful Life Sciences companies but accessing it quickly, in real-time, to make quick decisions is a challenge for those working in silos. Even more important, how do you make certain that the data is right and that you’re not arriving at the wrong conclusion?
It’s time to get more from your data, which is exactly why data science was developed as a concept in the early 1960s as computers became decision-making support systems. This new concept rose to the top as companies seeking to understand and interpret large amounts of amassed data also grew. It was not long after predictive analytics became popular that using statistical techniques from data mining and machine learning were also used to predict the future.
You have a golden opportunity to turn dirt into gold
The starting point for mining your data is to identify and harmonize the data. In pricing analytics, you need to make sure that there is a common understanding and definition of each price element so that you capture a list price and it is the same for all divisions and markets. For example, if some divisions are capturing the actual price, transaction price or end price, which also includes discounts, while others are capturing only the list price, the probability of reaching the wrong conclusions when analyzing the information increases significantly.
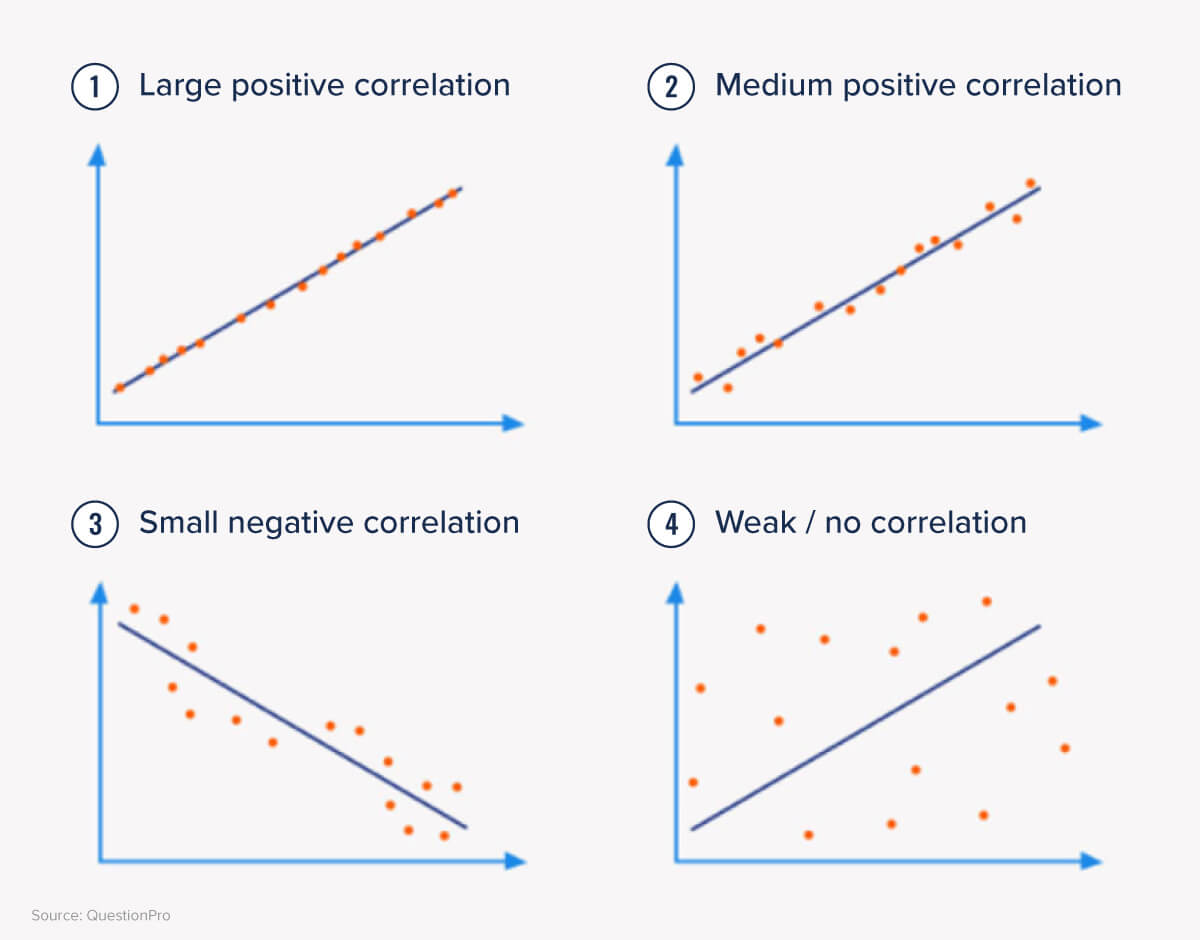
Once the information and datasets are identified and harmonized, the next step is to study the strength of their relationship. In a nutshell, what gets measured, gets managed. The point is that this relationship is quantifiable and you can use a scoring mechanism to quantify it.
You will need to study the correlation between the data to see if you can go beyond that point. For this, there are different techniques like Pearson correlation that will show us the linear relationship between two sets of data. In simple terms, it answers the question: Can I draw a line graph to represent the data?
Finding the data nuggets – worth their weight in gold
Continuing with the example of pricing analytics, you can analyze the Pearson correlation between the list price (the price you set) and transaction price (the actual price or what the customer at the end pays). This analysis allows you to see that in a robust relationship, the actual price should respond to changes in list price quickly and the ratio of actual price vs. list price remains constant over time. Understanding and quantifying the relationship between the list price and the actual price can assist you in making better pricing decisions. A strong and steady relationship that remains constant over time provides a strong framework for pricing decisions. However, a weak relationship that is hard to quantify will not provide much predictive power – but provides an opportunity for correction.
It is important to analyze the information from different angles to understand the relationship at the product level and by distribution channel – in the pharmaceutical industry, this analysis will be very different. For example, analyzing the hospital channel vs. wholesaler channel by country and by the plant.
Once you have seen the numbers, it’s time to see what really works and for that you want to use the Pearson super formula. We have formulas for understanding the price elasticity (the responsiveness of demand to changes in price) for a particular product. Price elasticity will also be the basis for the analysis of cannibalization – or how changes in prices for one product can cannibalize competing products where you analyze cross-elasticity. Let’s use an example: when a certain painkiller goes on price reduction, it will reduce the sale quantity of similar painkillers although the active ingredient is different, hence there is an interdependency between these two products that need to be considered.

The next step is to see what to do next and how data science can help change prices, proactively through price guidance, during a tender process or through price optimization with recommended price actions that adhere to pricing strategies or program optimization by estimating the effect on promotion types. Taking this a step further would include the possibility of recommended adjustments to the schedule.
Predictive analytics is the next golden nugget that will help Life Sciences companies like yours not only automate processes but also make faster decisions. The topic deserves a full discussion but until then, if you are interested in learning more, you won’t want to miss this strategic, analytics on-demand webinar.